Show Me The Weather
After connecting the e-ink display to the Pico and managing to get it to display in landscape mode I felt I’d solved the unknowns in making this e-ink weather display. Now it was time to decide what I was going to show, and how I was going to show it.
One Python example I’d found used a weather API called OpenWeather, so I went and signed up. Yet no matter what I seemed to do in terms of requesting API keys, and even waiting a day for activation, I was never able to make a valid request. In the meantime, with a little more Googling I found Meteo’s API. It turned out to be very easy to work with and had everything I’d need.
I chose some data fields I wanted to display and opened Photoshop to start a basic layout.
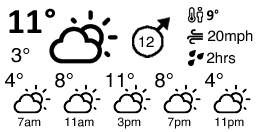
I wanted minimum and maximum temperatures during the day, a nice summary icon, average wind speed, and then a bit more info about how it would feel which is where the 9 degrees (“feels like” temperature), 20mph (wind gusts), and 2hrs (duration of rainfall during the day) came from. Below that is a little summary of what the weather looks like at four hour intervals..
The API call is just a request to a URL, such as this:
https://api.open-meteo.com/v1/forecast?latitude=XXXXX&longitude=XXXXX&hourly=temperature_2m,windspeed_10m,winddirection_10m,windgusts_10m,weathercode&daily=temperature_2m_min,temperature_2m_max,sunrise,sunset,windspeed_10m_max,windgusts_10m_max,winddirection_10m_dominant,precipitation_hours,apparent_temperature_max,weathercode&timezone=GMT&windspeed_unit=mphYou can request more fields in either the hourly or daily summary, and the documentation was pretty clear too.
The return is JSON and easily parsed with Micropython. I wrote a small module to do it all:
import network, rp2, time
import urequests
import json
import sys
from io import BytesIO

LATITUDE = 'XXXXX'
LONGITUDE = 'XXXXX'

BASE_URL = 'https://api.open-meteo.com/v1/forecast?'
URL = BASE_URL + 'latitude=' + LATITUDE + '&longitude=' + LONGITUDE + '&hourly=temperature_2m,weathercode&daily=temperature_2m_min,temperature_2m_max,sunrise,sunset,windspeed_10m_max,windgusts_10m_max,winddirection_10m_dominant,precipitation_hours,weathercode&timezone=GMT&windspeed_unit=mph'

# API documentation at https://open-meteo.com/en/docs
class Meteo:
    def __init__(self):
        self.json = None
        return

    def get_data(self):
        # Make GET request
        response = urequests.get(URL)
        if response.status_code != 200:
            print("Error")
            print(response.status_code)
            print(response.content);
            response.close();
            raise Exception("Error getting weather data " + response.status_code)
        else:
            self.json = response.json();
            response.close();
            return self.json;
I’d call it from a function, just so it was easier to test:
def getWeatherData():
    weather = meteo.Meteo();
    weather.get_data();
    return weather;
And accessing the data is just like accessing any Python object e.g. to get the maximum daily temperature:
max_daily = str(round(weather.json["daily"]["temperature_2m_max"][0]))So far so simple, and I was quickly on to drawing all of this to the display, which is the subject of the next post.